
Comscore has launched a new monthly report that looks strikingly similar to Nielsen’s “The Gauge,” but instead of measuring time spent with TV every month, the competing measurement and intelligence firm is hoping to offer a better view at television advertising exposure in the United States.
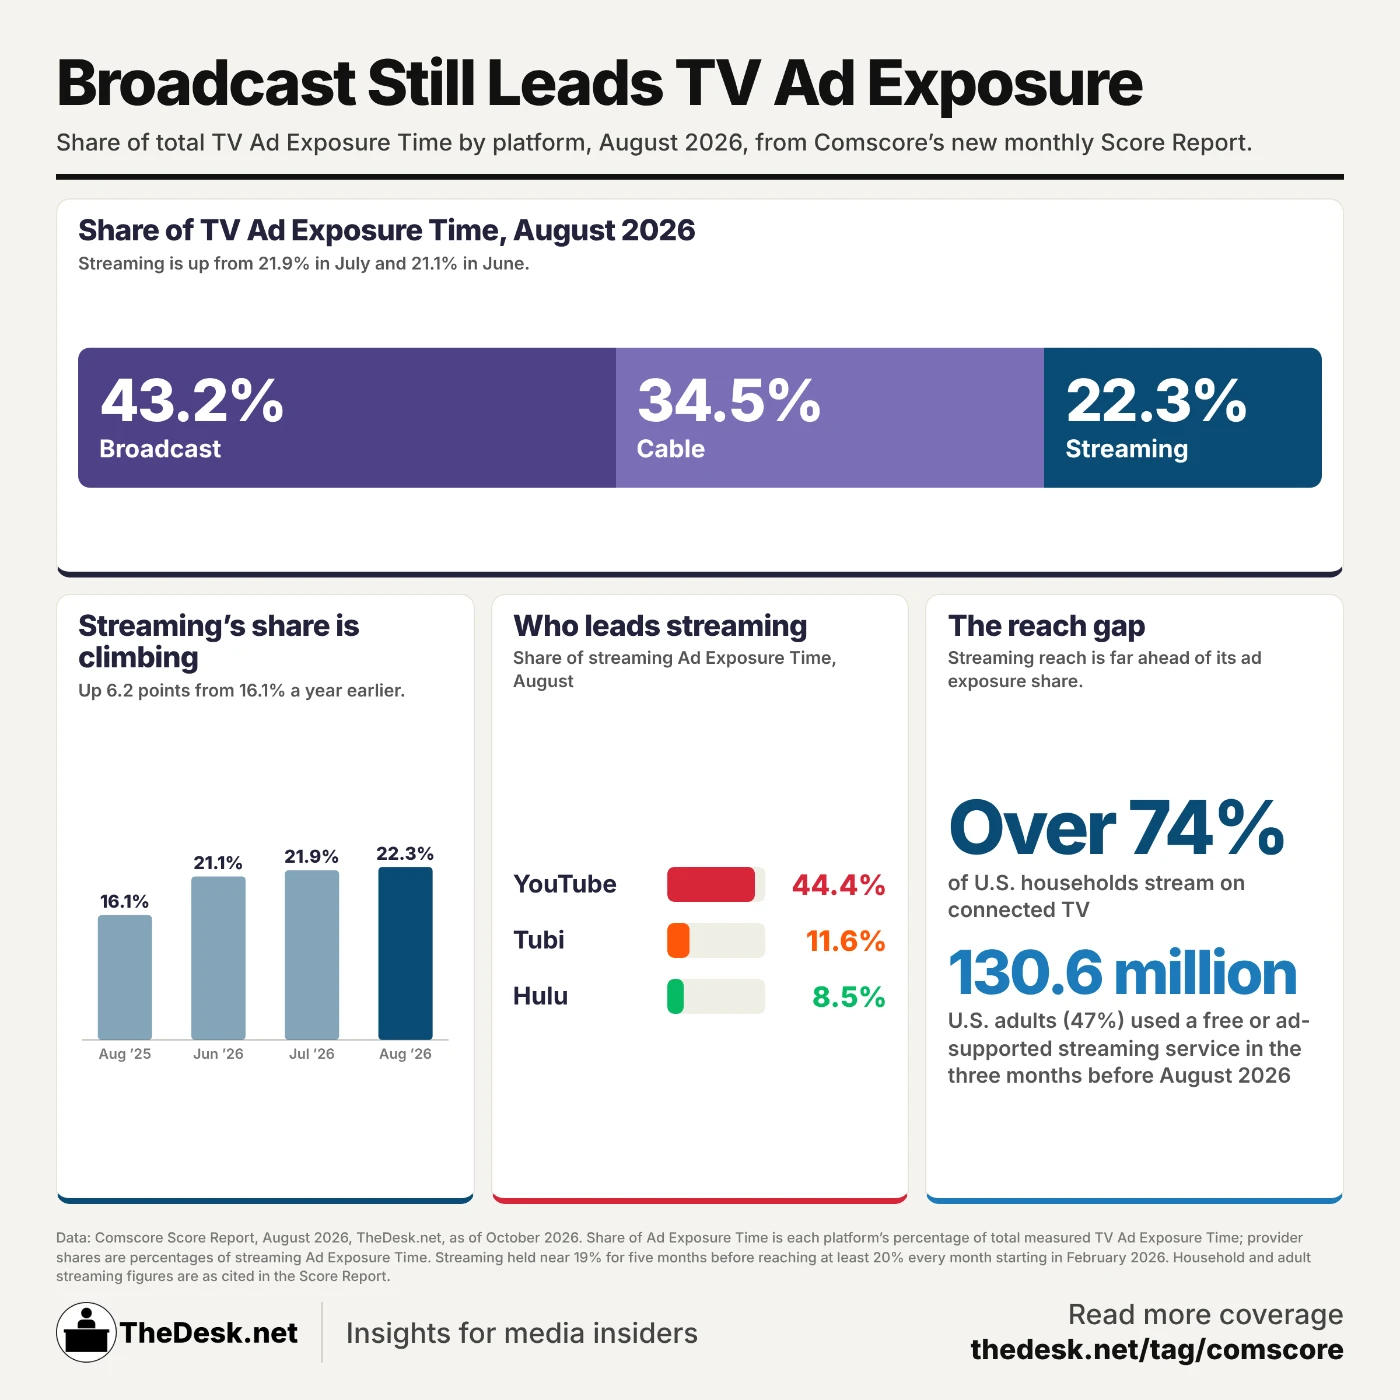
This week, Comscore released the first installment of its new monthly briefing called “The Score Report,” which showed broadcast TV captured more than 43 percent of measured TV advertising exposure compared with slightly more than 34 percent on cable networks and just over 22 percent on streaming platforms.
Comscore acknowledged that most American households — 74 percent — use some kind of connected TV device to watch shows and movies, either a streaming stick, set-top box or a smart TV platform itself. But traditional broadcast and cable TV programming accounted for nearly 78 percent of all measured ad exposure during the month of August — a strong indication that local news, premium sports and cable news commentary shows are attracting viewers to appointment-viewing, ad-supported content.

Still, streaming’s share is growing: Comscore said streaming platforms accounted for just over 21 percent of all TV ad exposure in June, a figure that climbed to just under 22 percent in July and just over 22 percent in August.
Streamers represent around one-fifth of all measured TV ad exposure every month since February, Comscore said, and its share was just under that in the preceding months.
Among ad-supported streamers, it probably comes as no surprise that YouTube came out on top, representing nearly 45 percent of all time spent with ad-supported streaming TV. Fox-owned Tubi ranked second with 11.6 percent share, followed by Disney-owned Hulu at 8.5 percent.
Already, that breakdown offers a stronger level of insight compared to Nielsen’s monthly “The Gauge” report, which measures share of time spent with TV. For months, Nielsen has counted Disney and Paramount’s streaming platforms as one.
Earlier this year, Nielsen began including a disclaimer in its report saying The Gauge was not used as a currency to evaluate and set advertising rates following pushback over the report’s methodology changes around the Super Bowl.

The Comscore report comes at a time when broadcasters are increasingly looking for alternative currencies by which to set their advertising rates after years of expressing frustration with Nielsen’s data. Three years ago, Nexstar Media Group issued a public call for a “next-generation audience measurement partner” after criticizing “current methods of audience measurement” as “inadequate.” The company did not directly criticize Nielsen, but was — and still is — a Nielsen client.
One year later, Paramount dropped Nielsen and forged an alternative measurement partnership with competing intelligence firm VideoAmp, a situation that made it difficult for CBS to report viewership data associated with its holiday football games. (The National Football League, which has a separate agreement with Nielsen, did report finalized figures.) The dispute was settled a few months later.
Still, Nielsen has faced criticism that its data doesn’t align with the narratives that broadcasters, cable networks, streaming platforms and some sports leagues want to publicize in an era where more traditional TV viewership is moving toward streaming.
Last year, a key executive at the NFL echoed criticism of Nielsen’s measurement solutions, but said the company’s shortcomings were improving over time. The comments were made as Nielsen prepared to further integrate its Big Data + Panels measurement solution, which incorporates data from its traditional panels product with analysis from connected TV and streaming platforms.
Earlier this month, Nielsen said it was working to bring a new suite of measurement products to market that will combine its proprietary insights with first-party data from publishers and distributors, saying artificial intelligence will play a role in how the data is analyzed and reported.
Nielsen said the approach will provide more comprehensive information about audience reach and time spent watching programming, addressing gaps in traditional measurement systems that rely heavily on samples of television households. The company intends to incorporate programming metadata alongside audience viewing information, allowing clients to better understand how individual titles perform across different distribution platforms.